Pre-attentive processing.
Abstract
Human beings interact with a number of different products every day. The information or signals from these products are processed by humans in stages. The signal is initially detected by biological receptors, then pre-attentively processed by the subconscious mind and finally processed cognitively. The focus of this paper is limited to pre-attentive processing. For designing products, it is important to understand how subconsciously information is accumulated from the surrounding environment and perceptually organized by the subconscious mind.
Using the available research, this paper discusses various pre-attentive processing theories and underlying neurological mechanisms that prevail in the human visual system. The paper also reflects on how patterns and groups are processed by the human neurological system. Further, different pre-attentive features like color, size, shape, proximity, continuation, connectedness and closure are discussed. Using these research, the paper then studies the design of ‘SHARP Advance D.A.L. EL-531XC’ calculator, concentrating on features that stimulate pre-attentive patterns and groupings. Finally, the paper concludes with design improvement recommendations.
1. Pre-attentive processing
(Ware C, 2013, p.143) In visual processing of information, after the signal is processed in the retina, it is transmitted to the lateral geniculate nucleus, or LGN, via optic nerve. Neurons from LGN then relay the signal to the Visual Cortex. Visual area 1 (V1) and visual area 2 (V2) are the first areas in the cortex to receive signals. Just like how cells in retina and LGN have distinctive receptive fields, cells in V1 and V2 too are differentially tuned to different features of visual field. (Lennie, 1998) According to Lennie, cells in V1 are sensitive to luminance, color, movement, depth, texture, direction and orientation and cells in V2 are sensitive to continuity in local structure as they have larger receptive fields. To explain pre-attentive processing, number of theories like guided search theory and feature integration theory have been proposed.
2.1. Feature integration theory
(Treisman & Gelade, 1980) As described by Treisman & Gelade, visual properties are detected early, sub-consciously, and in parallel across the visual field, while objects are detected in the later stages. These visual properties are referred as features. According to the feature-integration theory, the low-level human vision consists of manageable number of feature maps corresponding to one master map of location. There are individual feature maps for luminance, orientation, size, contrast, shape, texture, four color primaries and other pre-attentive features. When the human visual system sees an image, these Features or properties of the visual field are detected and registered into their respective maps. The maps are then retrieved to check for activity and amount of activity. However, they do not give any information about the relationships to activities in other feature maps independently. (Treisman & Gelade, 1980).
(Treisman, & Gormican, 1988) In 1988 Treisman collaborated with Gormican to identify pre-attentive feature using target detection experiments. Subjects were asked to detect the target accurately among distractors and their response time was recorded. The number of distractors were frequently increased. If the response time was invariable or below a minimum limit, the task was concluded to be processed pre-attentively. The evidence from response time suggested that colors, different levels of contrast, line curvature, line misalignment, proximity, terminators, and closure are distinguishable features. (Treisman, & Gormican, 1988).
2.2. Guided search theory
(Wolfe, Cave & Franzel, 1989; Wolfe, 1994) According to guided search theory, a set of feature maps corresponding to the visual space is built by parallel processing in the V1. However, unlike feature integration theory, each map is further decomposed into sub-categories of respective feature type. For instance, color map is categorized to represent red, green, blue, and yellow while orientation map is categorized to represent left, steep, right, shallow. When the human visual system sees an image, bottom-up activation results in feature categorization and top-down activation results in visual search for objects with specific feature or features. In other words, bottom-up activation directs attention to unusual field items, whereas top-down activation directs attention to non-distinctive but desired items. Activation map is summation of bottom-up activation and top-down activation. The value assigned to these two activations are based on the task being performed. A conjunction search would rely more on top-down activation, whereas search for a target with specific features would rely more on bottom-up activation. Regions, on activation map, corresponding to high bottom-up and top-down influence are represented as hills. Higher hills draw more attention and shorter hills draw less attention. (Wolfe, Cave & Franzel, 1989; Wolfe, 1994).
3. Grouping
Results from the visual search experiments conducted by (Treisman, & Gormican, 1988) provide evidence of visual field being grouped perceptually. However, (Grossberg, Mingolla & Ross, 1997) suggests how perceptual grouping is carried out neurologically. They proposed a Boundary Contour System, according to which the visual cortex, especially V1 and V2, perceives groupings using its laminar organization. Cells in V1 and V2 respond when contours spread across lines closer to one another. Furthermore, only cells in V2 respond when contours spread across lines with relatively larger distance between them. This activation of the relatively larger receptive field of the V2 cells, along with their bipole property, leads to boundary grouping.
(Leventhal et al., 1995) conducted a study which showed neurons in layers 2, 3 and 4 of the strait cortex (V1) are sensitive to orientation, color and direction. This means that a neuron tuned to blue color and vertical line can create grouping of these conjunction features. (Roelfsema, 2006) provided a two-part framework to explain how perceptual grouping is carried out neurologically. According to his framework, base-grouping and incremental grouping are the two mechanisms that lead to perceptual grouping. Base groupings are formed by single neurons that are sensitive to features like orientation, color and direction or a combination of these features. These neurons reflect the selectivity of feedforward connections. However, these single neurons are not tuned to all possible feature conjunctions. This is the reason why Roelfsema proposed the second part of the framework — incremental grouping. Incremental grouping is not as fast as base grouping as it depends on horizontal and feedback connections. In incremental grouping, responses of neurons tuned to specific feature conjunction is enhanced, thus drawing attention towards these feature conjunctions. (Roelfsema, 2006). Having made neurological connections to perceptual grouping, the focus is now shifted to understanding different grouping mechanisms.
3.1. Similarity
(Moore & Egeth 1997). Moore & Egeth were able to prove that perceptual organization, based on Gestalts principle of grouping by similarity, did occur. They conducted experiments using two perceptual illusions — Ponzo illusion, in which the patterns emerged two converging lines and Müller-Lyer illusion, in which the patterns emerged arrowheads. They formulated a model in which subjects were asked to judge length of two lines. The lines were lodged in a display comprising a large number of distractors in two different colors. The distractors from the display, during the critical trials, were grouped by color similarity such that the organization of distractors formed, caused the lines to undergo the influence of Müller-Lyer or Ponzo illusions. They concluded that if attention is not required for grouping to occur, the illusions should impact the performance of the subjects even when they were not paying attention to the grouping display. In fact, they uncovered that the line discrimination task was influenced by the illusions, although the subjects could not reveal what was presented in the background. Thus, Moore and Egeth provided evidence for grouping by similarity. (Moore & Egeth 1997).
(Treisman & Gelade, 1980) Further, Treisman & Gelade brought to light that objects that are dissimilar in color (red Os and Xs against blue Os and Xs) or shape (red and blue Os against red and blue Xs) separate easily into perceptual groups with strong prominence. Contrastingly, objects that are different only in the conjunction of colors and shapes (for example red Os mixed with blue Xs in one area against red Xs with blue Os in the other) do not automatically isolate into perceptual groups (Treisman & Gelade, 1980).
3.2. Proximity
Max Wertheimer (as cited in Wagemans et al., 2012) first demonstrated that dots placed at equal intervals do not organize together into perceptual groups. They can only be viewed as a uniform straight line. Wertheimer then changed the spacing between adjacent dots, so that some dots were at a shorter distance to each other than others. He observed that the dots closer to one another grouped strongly into pairs. This factor of relative distance, which Wertheimer called proximity, was the first of his famous laws of grouping.
Additionally, in an experiment conducted by (Rashal, Yeshurun and Kimchi, 2017), 20 students were administered to 2 blocks of 160 trials. In each trial, a central target was displayed surrounded by background elements, 24 red or blue solid circles, which were grouped as rows and columns. Students were asked to respond changes in the center target and background elements. While detecting changes on the target, recorded results revealed that a change in the background organization produced a congruency effect on the task performance. Thus, suggesting that grouping of rows and columns by proximity can be brought about without attention. (Rashal, Yeshurun and Kimchi, 2017).
3.3. Uniform Connectedness
(Palmer and Rock, 1994) Palmer and Rock argued that connectedness is a fundamental Gestalt organizing principle that the Gestalt psychologists missed. According to the principle of uniform connectedness, closed regions of indistinguishable features like brightness, color, texture, and others are likely to be perceived as a single component in the early stage of visual processing. Palmer and Rock showed the effects of uniform connectedness and also demonstrated that connectedness occurs even when set against salient organizing principles like similarity and proximity. (Palmer and Rock, 1994)
3.4. Continuation
(Ware C, 2013, p.183) “The Gestalt principle of continuity states that we are more likely to construct visual entities out of visual elements that are smooth and continuous, rather than ones that contain abrupt changes in direction.” (Prinzmetal & Banks, 1977) showed that perceptual grouping, just like Gestalts principal of similarity and proximity, depends on good continuation. They conducted target detection experiment with a line of a distractor that was a combination of alphabets ‘F’ and ‘T’. The target, either ‘F’ or ‘T’ was placed inside the distractor line or outside the line. Subjects were then asked to detect the in-line target or the out-of-line target. This experiment concluded that perceptual grouping leads to a good continuation. Further (Prytulak, 1974) confirmed that good continuation does not depend only on the degree of rectilinearity, but on a combination of rectilinearity, orientation, and enclosure.
3. Design Review of SHARP Advance D.A.L. EL-531XC calculator
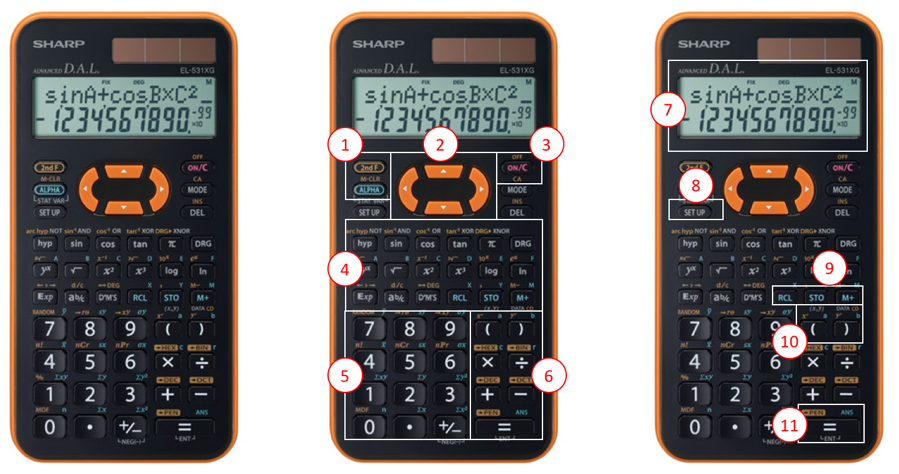
Figure 1: (Left) SHARP Advance D.A.L. EL-531XC calculator. (middle & Right) skeleton region map
In figure 1, a grouping of items in region 2 is very evident because of similarity in color. Also, the arrangement of items provides a distinct shape to the entire region as a whole. The space between the items is eliminated by the perceptual tendency of humans to close contours with gaps. (Ware C, 2013, p.183) Due to this, the region pop-out as a separate group. Items in regions 1 and region 3 are easily detectable due to its separate colors. However, it’s difficult to detect region 8 as it is placed between other regions with salient features.
Referring to figure 1, the items in region 4 are grouped together by the principal of size, similarity, and proximity. Though the shape of the items in region 4 is similar to items of region 5 and 6, the difference in the size of the items separates region 4 items from those in region 5 and 6. Likewise, though the size of the items in region 4 is similar to the items of region 1 and 3, variations in the proximity of the items separates region 4 items from those in region 1 and 3. The distinction between region 5 and region 4 is not very evident. This is because size difference between the items of region 4 and 5 is very low. In addition, the similarity in color and shape of the items makes it almost impossible to detect the regions as separate groups.
A clear distinction between region 7 and other regions is obvious. This is because of the difference in color, size, and shape of region 7. Proximity also plays an important role in this perception. Due to the greater distance between region 7 and the other regions, the separation of region 7 is very evident. Also, the items within the region 7 are perceived as the same object due to lack of proximity between themselves.
As seen in figure 1, the items in region 10 are placed at the boundary of 3 groups. Their size is slightly more than the size of the items in region 4 and slightly less than the size of items in region 5. The shape of the items in region 10 is similar to that of items from all the surrounding groups. There is a slight variation of color between the items in region 10 and region 6. Since region 10 items are dissimilar only in the conjunction of features with the items from the surrounding group, they do not segregate themselves. (Treisman & Gelade, 1980). Similarly, the items in region 9 do not segregate themselves as they share features with the items in region 4.
Even though the size of region 11, in figure 1, is greater compared to the size of other items around it, it is difficult to detect the region 11. The effect of this difference in size is too subtle to make region 11 pop-out. The similarity of color and shape and equal proximity between the items takes more precedence over the difference in size, thus, eliminating the subtle distinction and grouping region 11 with region 6. According to feature integration theory, when objects are grouped preattentively, attention is focused on groups and not on individual objects. (Treisman & Gelade, 1980). As region 11 is perceived as an object of region 6, it becomes difficult to detect it pre-attentively.
4. Recommendations
Using Gestalts principal of grouping by the similarity of color, proximity, and closed region, the design of SHARP Advance D.A.L. EL-531XC calculator can be improved in a way that the grouping between different items is evident and frequently used items can be detected easily. Color can play a vital role in creating the groupings. Providing different colors to different regions will create a clear grouping of items as shown in figure 2.
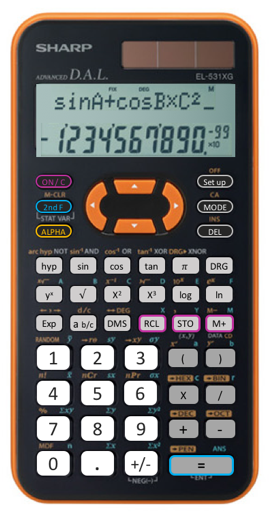
Figure 2: Design Recommendation
Also, Items from region 1 and 3 (refer to figure 1) should be placed together. This rearrangement, as shown in figure 2, would enable them to pop-out even more.
The spacing between items of region 7 (refer to figure 1) should be increased. This will segregate the items from one another as shown in figure 2.
Finally, a subtle color change to items of regions 9 and 11 (refer to figure 1) can make them pop-out from their respective group. Refer figure 2 to see how adding an outline makes these items pop-out within their own groups.
References
Grossberg, S., Mingolla, E., & Ross, W. D. (1997). Visual brain and visual perception: How does the cortex do perceptual grouping?. Trends in neurosciences, 20(3), 106-111.
Lennie, P. (1998). Single units and visual cortical organization. Perception, 27(8), 889-935.
Leventhal, A. G., Thompson, K. G., Liu, D., Zhou, Y. I. F. E. N. G., & Ault, S. J. (1995). Concomitant sensitivity to orientation, direction, and color of cells in layers 2, 3, and 4 of monkey striate cortex. Journal of Neuroscience, 15(3), 1808-1818.
Moore, C. M., & Egeth, H. (1997). Perception without attention: Evidence of grouping under conditions of inattention. Journal of Experimental Psychology-Human Perception and Performance, 23(2), 339-352.
Palmer, S., & Rock, I. (1994). Rethinking perceptual organization: The role of uniform connectedness. Psychonomic bulletin & review, 1(1), 29-55.
Pomerantz, J. R., & Pristach, E. A. (1989). Emergent features, attention, and perceptual glue in visual form perception. Journal of Experimental Psychology: Human Perception and Performance, 15(4), 635.
Prinzmetal, W., & Banks, W. P. (1977). Good continuation affects visual detection. Attention, Perception, & Psychophysics, 21(5), 389-395.
Prytulak, L. S. (1974). Good continuation revisited. Journal of experimental psychology, 102(5), 773.
Rashal, E., Yeshurun, Y., & Kimchi, R. (2017). Attentional requirements in perceptual grouping depend on the processes involved in the organization. Attention, Perception, & Psychophysics, 79(7), 2073-2087.
Roelfsema, P. R. (2006). Cortical algorithms for perceptual grouping. Annu. Rev. Neurosci., 29, 203-227.
Treisman, A. M., & Gelade, G. (1980). A feature-integration theory of attention. Cognitive psychology, 12(1), 97-136.
Treisman, A. (1982). Perceptual grouping and attention in visual search for features and for objects. Journal of Experimental Psychology: Human Perception and Performance, 8(2), 194.
Treisman, A., & Gormican, S. (1988). Feature analysis in early vision: Evidence from search asymmetries. Psychological review, 95(1), 15.
Wagemans, J., Elder, J. H., Kubovy, M., Palmer, S. E., Peterson, M. A., Singh, M., & von der Heydt, R. (2012). A century of Gestalt psychology in visual perception: I. Perceptual grouping and figure–ground organization. Psychological bulletin, 138(6), 1172.
Ware C. (2013). Information Visualization, Perception of Design (3rd ed.). San Diego, CA: Academic Press
Wolfe, J. M., Cave, K. R., & Franzel, S. L. (1989). Guided search: an alternative to the feature integration model for visual search. Journal of Experimental Psychology: Human perception and performance, 15(3), 419.
Wolfe, J. M. (1994). Guided search 2.0 a revised model of visual search. Psychonomic bulletin & review, 1(2), 202-238.